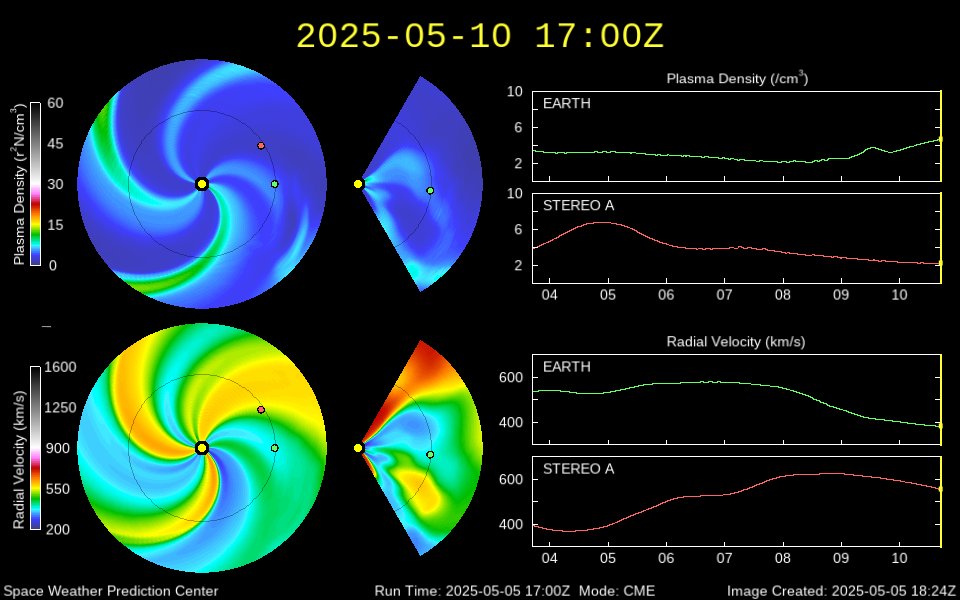

 Above - Click The Dials For The NWS Space Environment Center's Latest Space Weather Update.
Click The Satellite Photo For The NWS Spaceflight Meteorology Group's Latest Space Shuttle Weather Update.
Below - Check
Out These GOES East and West Operational Satellite Links From The National Weather Service including...Infrared, Visible, & Water Vapor Imagery. This Includes Severe Weather, Precipitable Water Vapor, Multi Layer Winds, Jet Stream, Microburst Wind Risk, & Snow Cover Imagery from NOAA-NESDIS. Click The Infrared, Visible, & Water Vapor Imagery To View Loops From NOAA-NESDIS. All Other Imagery Enlarges When Clicked.
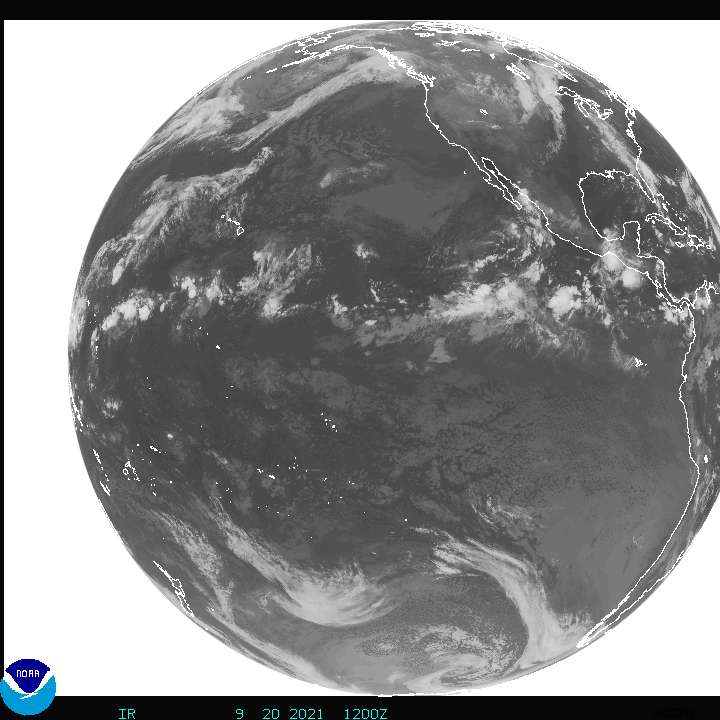
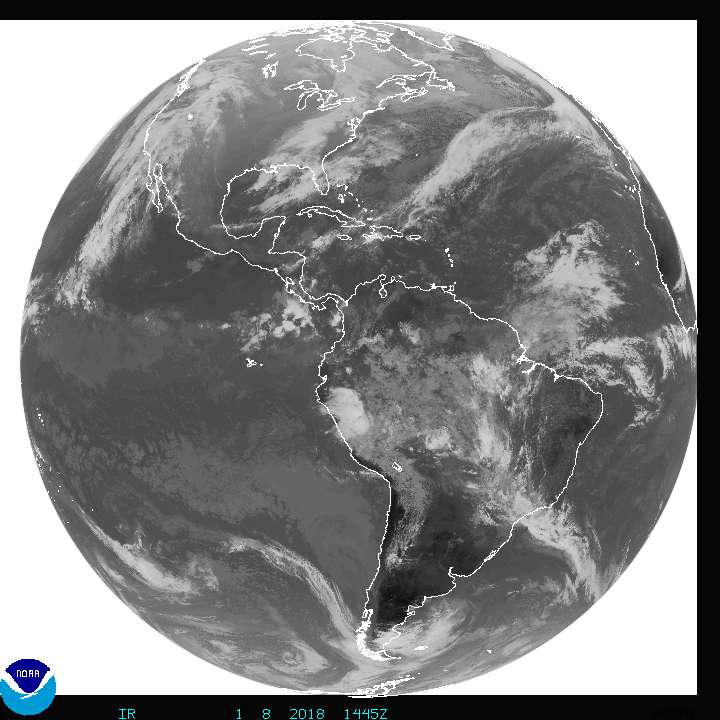


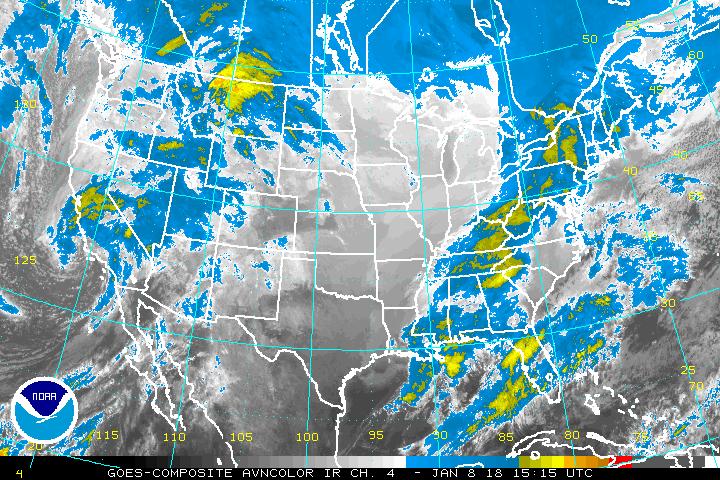

Above: GOES Full Disc Infrared & Full Disc Water Vapor Wind Imagery. Also, Continental US Visible, Infrared, & Water Vapor Imagery.
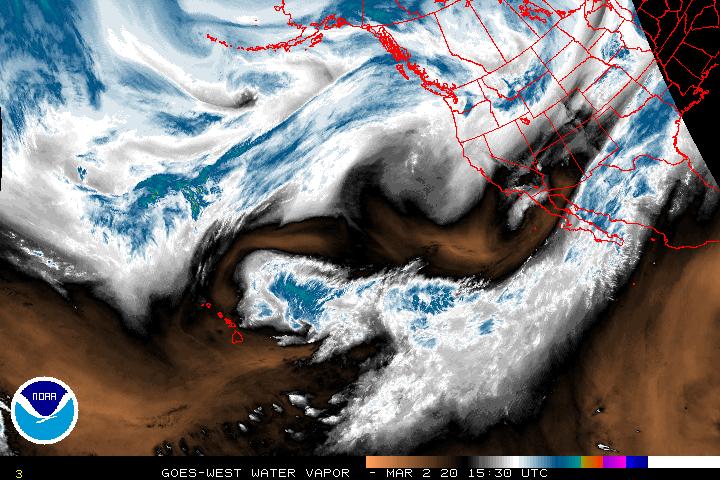


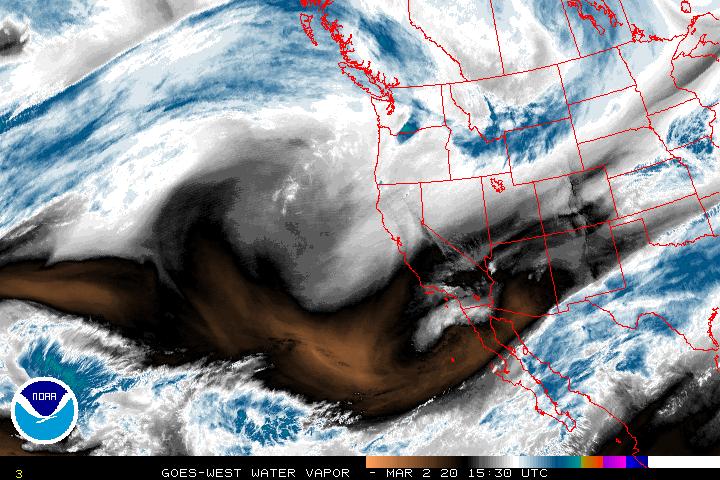


Above: GOES NE Pacific (Including Alaska & Hawaii), U.S. Gulf Coast, & NW Atlantic Water Vapor, Western & Eastern Continental U.S. Water Vapor Loops & Hurricane Potential Imagery. High Density Winds, Jet Stream, & Station Sounding Imagery.


Above: GOES Sounder Skin Temperature Loop In Deg. F., &, Cloud Top Pressure & Temperature Loop Imagery.

Above: GOES Satellite Precipitation Estimate Messages, &, (WPC) Mesoscale Precipitation Discussions (MPDs).


Above: GOES Sounder Precipitable Water Imagery In Millimeters (MM.) Left & Loop In Inches (IN.) Right.


Above: GOES 850-500MB Lapse Rate In Deg C./KM. Loop (Left) & Showalter Index Loop In Deg. C. (Right)


Above: GOES Lifted Index (In Deg. C.) Imagery (Left) & Loop (Right)..


Above: GOES Convective Available Potential Energy (CAPE) in Joules/KG. Imagery (Left) & Loop (Right)..


Above: GOES Convective Inhibition (CINH) In Joules/KG. Imagery (Left) & Loop (Right)..


Above: GOES Microburst Risk Imagery. Notes: 1. Microburst Wind Potential Index (MWPI) Imagery (Left) Are Available Between 1300Z & 2300Z (8AM CST & 5PM CST). Wet Microburst Severity Index (WMSI) (Center) & Maximum Potential Convective Wind Gust (WINDEX)(Right) Are Available Between 1600Z & 2300Z (10AM CST & 5PM CST). 2. The Colored Numbers In The Photos Are Not Actual Wind Speeds, They Are Indices. 3. To Estimate Microburst Risk, Match The Color Of The Numbers To The Scale At The Bottom Of Each Picture. 4. Maximum Microburst Wind Gust Speeds Are In Knots (KTS). 5. Severe Thunderstorm Microburst Wind Gust Speeds Are > 50 KTS. Or, (58 MPH).


Top Row: WFO (ICT)'s GOES East - IR Loop, WFO (SGF)'s GOES East - IR Loop, WFO (PAH)'s GOES East - IR Loop,
Middle Row: WFO (TSA)'s GOES East - IR Loop, WFO (LZK)'s GOES East - IR Loop, WFO (MEG)'s GOES East - IR Loop,
Bottom Row: WFO (FWD)'s GOES East - IR Loop, WFO (SHV)'s GOES East - IR Loop, WFO (JAN)'s GOES East - IR Loop.


Above: GOES Sounder Current Alaskan, Continental US, & Northern Hemisphere Snow & Ice Cover.
Current
National Geostationary Operational Environmental Satellite Data
The NWS Satellite Services Division
GOES West AND East Real-Time Data and Derived Products Page.
Realtime GOES West AND East Satellite Images From NOAA NESDIS.
GOES West AND East Temperature And Moisture Soundings Including Convective Indices.
More GOES West AND East Temperature And Moisture Soundings Including Convective Indices.
NOAA-NESDIS GOES West & East Sounder Derived Product Imagery Including Severe Weather Indices.
NOAA-NESDIS GOES West & East Derived Products Including Satellite Precipitation Estimate Messages.
GOES Satellite-Based Nowcasting & Aviation Application Program Convective Storm Monitoring and Nowcasting Products Page.
NOAA NESDIS-ORA GOES West AND East Derived Flash Flood Products Page.
NOAA-NESDIS Operational Products Development Center for Satellite Applications & Research.
GOES West AND East Microburst Products From The Office of Research and Applications.
GOES Nighttime Fog and Low Cloud Imagery -
Operational Products Development Branch.
NOAA-NESDIS Satellite Services Division Graphical Operational Daily Snow Cover Analysis.
Satellite Interpretation Tutorials & Image Examples -From The GOES-R Program Office.
The National Weather Association
Training Committee's GOES Weather Satellite Links.
You May Also,
Click Here To Go To The Doppler Weather Radar Center,
Go To The Natural Hazard Maps & Models Center, Or,
Back To The Main Office.